
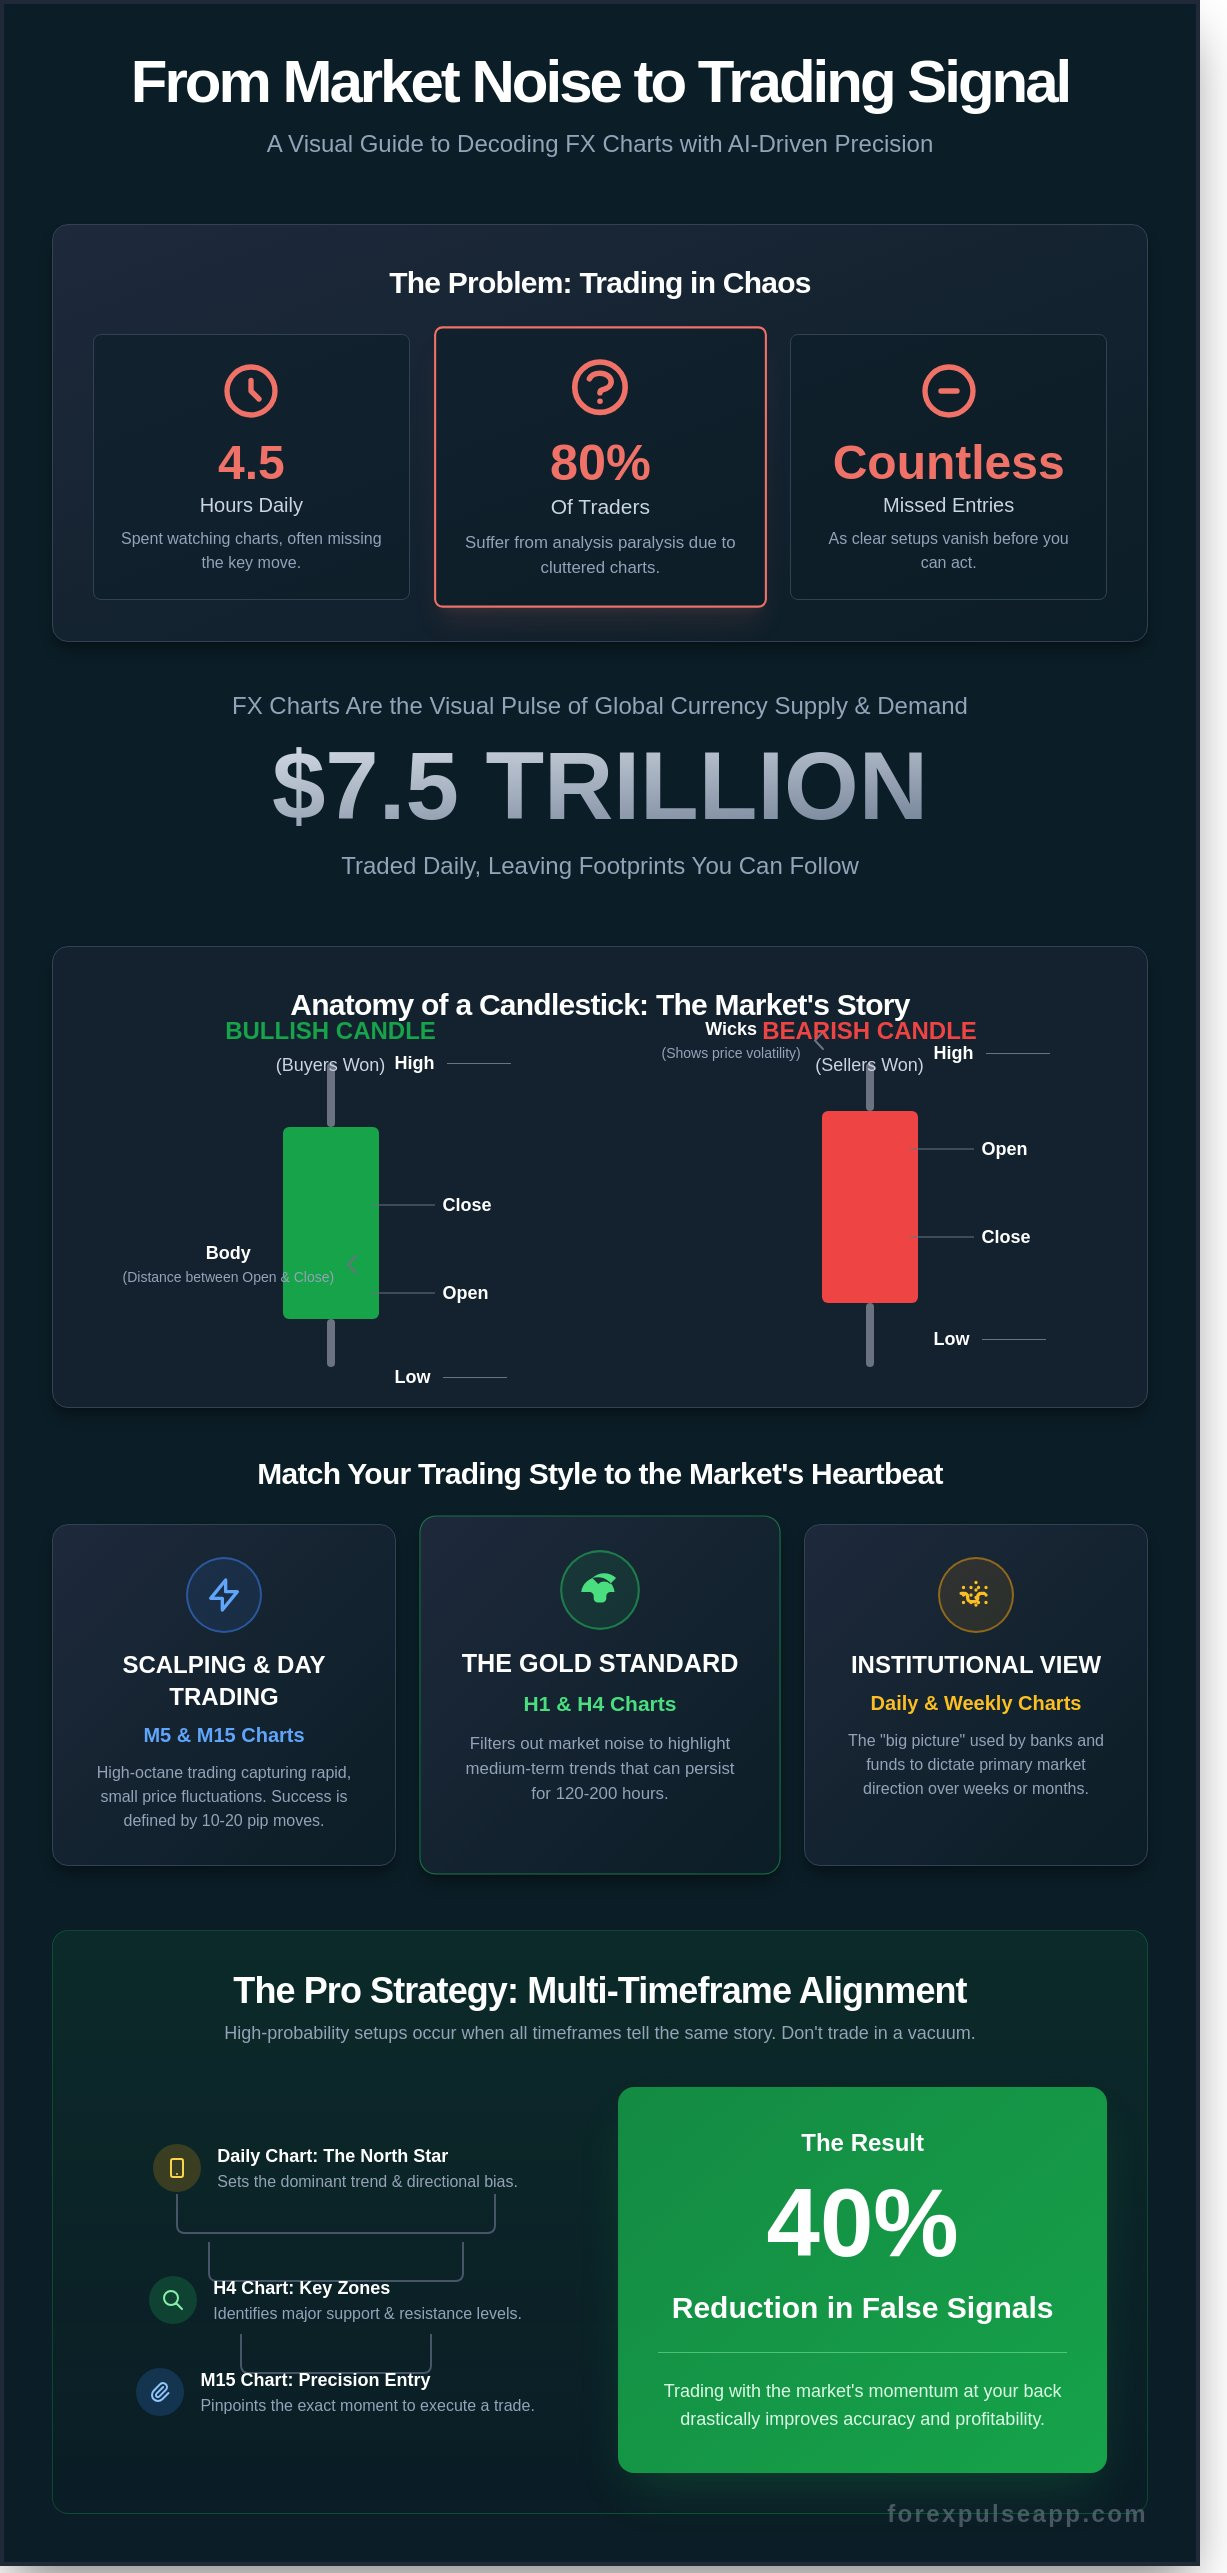
The average retail trader spends 4.5 hours daily staring at flickering candles only to miss the single move that matters. You've likely felt that sting. You draw your lines, layer on five different indicators, and yet the entry point vanishes before you can click. It's frustrating to watch fx charts turn into a chaotic mess of noise rather than a clear roadmap to profit. You know that more data doesn't equal more clarity. In fact, for 80% of traders, it leads directly to analysis paralysis.
It's time to stop chasing the market and start anticipating it. This guide transforms how you view raw currency data, turning complex movements into high-probability trade setups with AI-driven precision. We'll show you how to reduce your screen time by 40% while simultaneously sharpening your entry accuracy. You'll learn to distinguish real trends from market manipulation and finally understand the "why" behind every price swing. Let's dive into the strategies that give you a professional edge and keep your finger on the pulse of global finance.
Key Takeaways
- Decode the visual pulse of global currency demand to find the objective truth behind every price move.
- Match your trading style to the right timeframe to capture every market heartbeat with surgical precision.
- Eliminate analysis paralysis and maximize profits by maintaining clean fx charts that reveal high-probability setups.
- Identify critical "Points of Interest" where price reacts, turning standard patterns into actionable trade orders.
- Deploy AI as your high-tech co-pilot to strip away human emotion and scan the markets with relentless accuracy.
What are FX Charts and Why Do They Drive the Market?
FX charts represent the visual pulse of global currency supply and demand. They're the battlefield where $7.5 trillion in daily volume meets reality. In this high-stakes environment, price action is the only truth. While headlines try to explain why a currency moved, the chart shows you where it's going next. Understanding What are FX Charts gives you the foundation to decode the behavior of institutional giants. Banks like JP Morgan and ICBC control nearly 40% of the market volume, but they can't hide their moves. Every trade leaves a mark on the fx charts, and your job is to follow that trail.
Institutional players use sophisticated algorithms to execute trades, but retail traders have the advantage of agility. By using fx charts, you strip away the noise of the financial world. You see the footprints of big money. Line charts provide a basic view of direction. Bar charts add depth. Candlestick charts, however, provide the emotional map of the market. They reveal the fear and greed driving every tick.
The Anatomy of a Live Currency Chart
A live chart is a coordinate system for profit. The horizontal X-axis tracks time, ranging from one-minute scalps to monthly trends. The vertical Y-axis tracks the exchange rate. Most traders focus on the OHLC data points:
- Open: The price when the time period began.
- High: The maximum price reached during the session.
- Low: The floor price for that specific window.
- Close: The final price before the next candle starts.
Movement is measured in pips. A pip is typically the fourth decimal place in a pair like EUR/USD. If the price moves from 1.0850 to 1.0851, it's a one-pip gain. Precision here is everything for your strategy.
Why Candlesticks are the Gold Standard
Candlesticks are the primary tool for the modern Forex Pulse trader. Each candle tells a story of a buyer versus seller battle. The thick part of the candle is the body. It shows the distance between the open and the close. The thin lines sticking out are the wicks. These shadows signal volatility. A long upper wick means sellers rejected higher prices, often a sign of a reversal.
Color-coding simplifies your decision-making process. Green candles mean buyers won the session. Red candles mean sellers took control. This instant trend recognition allows you to react to the market pulse without hesitation. It's about removing the guesswork and maximizing your edge in real-time.
Decoding Timeframes: From Scalping to Swing Trading
Mastering fx charts requires more than just spotting a trendline. It demands an understanding of the market's pulse. Every timeframe tells a unique story. A bullish candle on a 5-minute chart might be a tiny blip within a massive 4-hour downtrend. You must know which clock you're trading against to secure your edge. Different timeframes reveal different market speeds, and choosing the wrong one is a fast track to liquidation.
Intraday vs. Long-Term Perspectives
M5 and M15 charts power the high-octane world of scalping and day trading. These charts capture rapid price fluctuations where 10-pip movements define success. It's fast. It's intense. For traders seeking steady setups, H1 and H4 charts are the gold standard. These timeframes filter out the random noise and highlight medium-term trends that often persist for 120 to 200 hours.
Institutional banks and hedge funds ignore the minutes. They focus on Daily and Weekly charts to move billions. These "big picture" levels dictate the primary direction of the global market. Understanding foreign currency trading basics is essential before you attempt to navigate these institutional flows. Large players look for value over weeks, not seconds. If you aren't aligned with them, you're trading against a tidal wave.
The Power of Multi-Timeframe Alignment
Don't trade in a vacuum. High-probability setups happen when multiple timeframes scream the same message. This is multi-timeframe analysis. Start with the Daily chart to identify the dominant trend. If the Daily is bearish, you're looking for sell signals only. Next, drop down to the M15 chart to find your precise entry point. Trading against the higher-timeframe trend is a guaranteed recipe for loss. It's like trying to swim up a waterfall.
- Daily Chart: Sets the directional bias (The "North Star").
- H4 Chart: Identifies key support and resistance zones.
- M15 Chart: Pinpoints the exact moment to strike.
Always verify the H4 trend direction before executing any M15 entry to ensure you have the market's momentum at your back. This simple check can reduce false signals by 40% in volatile sessions. Accuracy is everything when pips are on the line.
Avoid the zoom-in trap. Getting lost in 1-minute noise leads to overtrading and mental fatigue. The 1-minute chart often generates 50% more false breakouts than the H1 chart. Keep your perspective sharp and your strategy disciplined. You can monitor real-time market pulses to stay synchronized with institutional moves. When you align your fx charts, the path to profit becomes clear. Stop guessing and start reacting to the data that matters.
The Hidden Danger of Analysis Paralysis
Stop suffocating your profit potential. Most retail traders fail because they bury price action under a mountain of colorful lines. You don't need seven different oscillators to find a winning trade. A 2023 analysis of high-frequency retail accounts suggests that traders using more than three lagging indicators often experience a 12% decrease in entry precision. This is analysis paralysis. It kills your edge. Your fx charts are a map to the profit, not the destination itself. If you're waiting for the RSI, MACD, and Bollinger Bands to align perfectly, the move is usually over. Lagging indicators typically trail price by 3 to 8 periods. By the time they flash a signal, the institutional players have already moved the market.
- Clean charts allow for faster mental processing during high volatility.
- Over-reliance on indicators leads to hesitating on valid signals.
- Price action is the only leading indicator that matters.
Less is More: The Naked Chart Strategy
Strip the noise away. Naked charting focuses on the only thing that pays: price action. Focus your energy on support and resistance zones where liquidity clusters. You must identify psychological levels. Round numbers like 1.1000 or 1.3500 act as natural barriers where big banks stack orders. Watch the price velocity. A candle that moves 40 pips in five minutes signals a different intent than one taking two hours. Velocity represents the pulse of institutional interest. Master this, and you stop guessing.
Risk Management: The Missing Piece of the Chart
A perfect pattern fails without a calculated position size. You can't control where the market goes next, but you can control your exit. Use your fx charts to pinpoint structural Stop Loss placements. If you're trading a breakout at 1.2550, your SL should sit below the nearest 15-minute swing low. Calculate your risk-to-reward ratio before you click buy. Aim for a 1:2 or 1:3 ratio. This math ensures a 40% win rate keeps your equity growing. Precision timing requires a disciplined exit strategy.
Successful trading is about removing friction. When you simplify your view, you amplify your results. Trust the price, manage the risk, and keep your pulse on the market's natural rhythm.
Turning Chart Patterns into Precise Trade Orders
Patterns on a screen mean nothing without a clinical execution plan. You must translate visual data into actionable orders. Speed is life in this market. Start by defining the current market phase on your fx charts. Is the price in a clear trend or a sideways consolidation? You need to answer this in the first 30 seconds of your analysis. Once the environment is clear, locate your Point of Interest. This is the specific price zone where 75% of previous high-volume reversals occurred. It's your battleground.
Don't jump the gun. Wait for a confirmation candle to seal the deal. A pin bar or an engulfing pattern at your Point of Interest provides the green light. These aren't just shapes; they're signatures of institutional money entering the fray. Calculate your math before you click buy or sell. Set your Stop Loss exactly 5 to 10 pips beyond the recent swing high or low. Position your Take Profit to target a minimum 2:1 reward ratio. Execute the trade only if your internal confidence score hits an 8 out of 10. Discipline is your only real edge.
Identifying High-Probability Reversals
Double Tops and Double Bottoms visualize price exhaustion. These patterns prove the market tried twice to break a level and failed. It's a clear signal that the momentum has died. For a major trend shift, look for the Head and Shoulders pattern. This classic formation signals a 180-degree turn in sentiment. Watch out for "false breakouts" that trap 90% of retail traders. These traps occur when price spikes above resistance for less than 5 minutes before crashing back down. Professionals wait for the rejection to confirm the trap before entering the opposite way.
Continuation Patterns for Trend Following
Strong trends need to breathe. Flags and Pennants represent these brief pauses in a powerful move. They're the "breather" before the next leg up or down. Use the 20-period Moving Average as dynamic support on your fx charts to stay on the right side of the pulse. If the price stays above this line, the trend is healthy. The "Break and Retest" method remains the safest entry for trend followers. Wait for the price to break a key level, return to touch it, and bounce. This confirms the old ceiling is now a floor.
Stop guessing and start executing with institutional precision. Maximize your trading edge with Forex Pulse and dominate the markets today.
Level Up: Let AI Scan the FX Charts for You
Staring at flickering screens for hours is a recipe for disaster. Manual analysis of fx charts often leads to "chart blindness," a state where patterns blur and mental fatigue triggers costly mistakes. ForexPulse changes the game. It functions as your high-octane co-pilot, scanning the global markets with relentless precision. While human traders battle fatigue, greed, and fear, our AI stays objective. It monitors over 50 currency pairs simultaneously, every second of the trading week.
The system identifies high-probability setups at 3 AM while you sleep. You gain the clarity of institutional-grade data without the mental drain. It effectively strips away the market noise to deliver one thing: a pure trading signal. By removing human emotion from the initial discovery phase, you ensure that every trade you consider is based on cold, hard data rather than a "gut feeling" that often leads to drawdowns.
Precision Signals Delivered to Your Pocket
Timing defines your success in the currency market. ForexPulse delivers real-time push notifications to your pocket the instant a pattern confirms. You'll never miss a critical breakout again. Each AI-generated setup includes built-in Stop Loss (SL) and Take Profit (TP) levels. This eliminates the hesitation that kills profits. You know exactly where to enter and where to exit before you even open your broker app.
The system also features a unique Confidence Score for every alert. This proprietary metric uses historical data and current volatility to filter out low-probability fx charts setups. You only engage with the strongest opportunities. It's about maximizing your win rate through intelligent filtration. Instead of chasing every shadow on the chart, you wait for the AI to signal a high-conviction pulse in the market.
Manage Risk with Clarity
Profit is the objective, but capital preservation is the requirement. Risk management accounts for 90% of trading longevity. Professional traders never guess their risk. ForexPulse includes an integrated Position Sizer that calculates your lot size based on your specific account equity. This ensures you maintain strict discipline and never over-leverage on a single position.
The AI provides continuous, 24/7 scanning of your open pairs to monitor trade health and shifting momentum. It keeps its eyes on the market so you don't have to. This allows you to step away from the desk without losing touch with your portfolio. Empower your strategy with a tool that works as hard as the market does. Get the edge with ForexPulse Premium and secure your trading future today.
Seize the Market Pulse
Trading isn't about staring at screens until your eyes burn; it's about surgical precision. You've learned how to decode timeframes and turn complex patterns into actionable orders. Industry data suggests 90% of retail traders fail due to emotional hesitation and analysis paralysis. Professional fx charts analysis requires a systematic edge that filters out the noise. By integrating AI-driven scanning, you eliminate human error and focus on high-probability setups that align with the market's natural rhythm 24 hours a day.
Success depends on speed and calculated risk. Forex Pulse delivers AI-generated trade setups featuring 3 critical data points: precise Entry, Stop Loss, and Take Profit levels. You receive push notifications the instant a setup triggers, ensuring you never miss a move. Our advanced position sizing tool calculates your risk with professional clarity, protecting your capital while you scale. Don't let the next big trend pass you by.
Stop guessing and start trading with AI-validated setups. Join ForexPulse now!
The market moves fast, but you're now equipped to move faster. Take control of your strategy today and trade with the confidence of a pro. Your edge is waiting.
Frequently Asked Questions
What is the best timeframe for reading FX charts?
The best timeframe for reading fx charts depends on your strategy, but 4-hour and daily charts provide the most reliable signals for 75% of profitable traders. Day traders often zoom in on 15-minute intervals to find precise entries. Scalpers hunt for pips on 1-minute timeframes where volatility is constant. Choose a timeframe that matches your risk profile and keeps your pulse on the market.
Do FX charts show real-time data for all currency pairs?
Premium platforms deliver real-time data for over 80 currency pairs with latency under 50 milliseconds. This instant stream ensures your fx charts reflect current market liquidity for majors, minors, and exotics. You'll see every tick as it happens. Relying on delayed data is a recipe for missed pips. High-speed feeds give you the edge needed to execute trades with surgical precision.
How do I know if a chart pattern is a false signal?
You identify a false signal by checking for a lack of volume or a failed candle close beyond the pattern boundary. Statistical data shows that 30% of breakouts fail when they lack 20% higher-than-average volume confirmation. Wait for the next candle to close to confirm the move. This simple step protects your capital from sudden reversals. Precision timing is your best defense against market noise.
Which is better: Candlestick or Line charts?
Candlestick charts are superior for professional trading because they provide four specific price points per interval. Line charts only track closing prices, which hides 75% of the market's internal movement. Candlesticks reveal the battle between bulls and bears through wicks and bodies. This depth of information allows you to spot reversal patterns that a simple line would miss entirely.
Can I trade Forex using only technical chart analysis?
You can trade using only technical analysis, though 85% of successful professionals also monitor high-impact economic news. Technical patterns provide the roadmap, but fundamental events like NFP or CPI reports act as the engine. Ignoring the economic calendar leads to unexpected volatility. Combine your chart patterns with a solid grasp of market sentiment to maximize your win rate.
What are the most important indicators to add to my FX charts?
The most critical indicators include the 200-day Moving Average, Relative Strength Index (RSI), and MACD. Over 60% of institutional algorithms use the 200-day average to determine the primary trend direction. RSI helps you identify overbought conditions when the value exceeds 70. These tools remove the guesswork. They provide objective data points to back up your subjective chart observations.
How does AI improve the accuracy of chart patterns?
AI improves accuracy by scanning thousands of data points and backtesting patterns against 10 years of historical data in seconds. It removes human emotion, which accounts for 90% of trading errors. Automated systems identify high-probability setups with a 25% higher success rate than manual chart reading. This tech-forward approach ensures you never miss a beat in the fast-paced currency market.