In 2026, a three-second delay in your data feed isn't just a technical glitch; it's a direct tax on your capital. You've likely felt the sting of a missed move during the London open because your current tools lagged or froze. Relying on cluttered, high-latency live forex charts turns potential profits into painful lessons. You recognize that the market doesn't wait for anyone, and your strategy shouldn't either.
We understand that analysis paralysis often strikes hardest when the Tokyo and Dubai sessions overlap and indicators start to conflict. This article promises to help you unlock the power of real-time currency data and AI-driven analysis to dominate the Asia, Middle East, and Europe trading sessions. You'll discover how to identify precise entry points, reduce risk through superior visualization, and align your trades with the sharpest AI-backed insights available. We'll break down the specific tactics you need to master the pulse of the global markets and finally gain your professional edge.
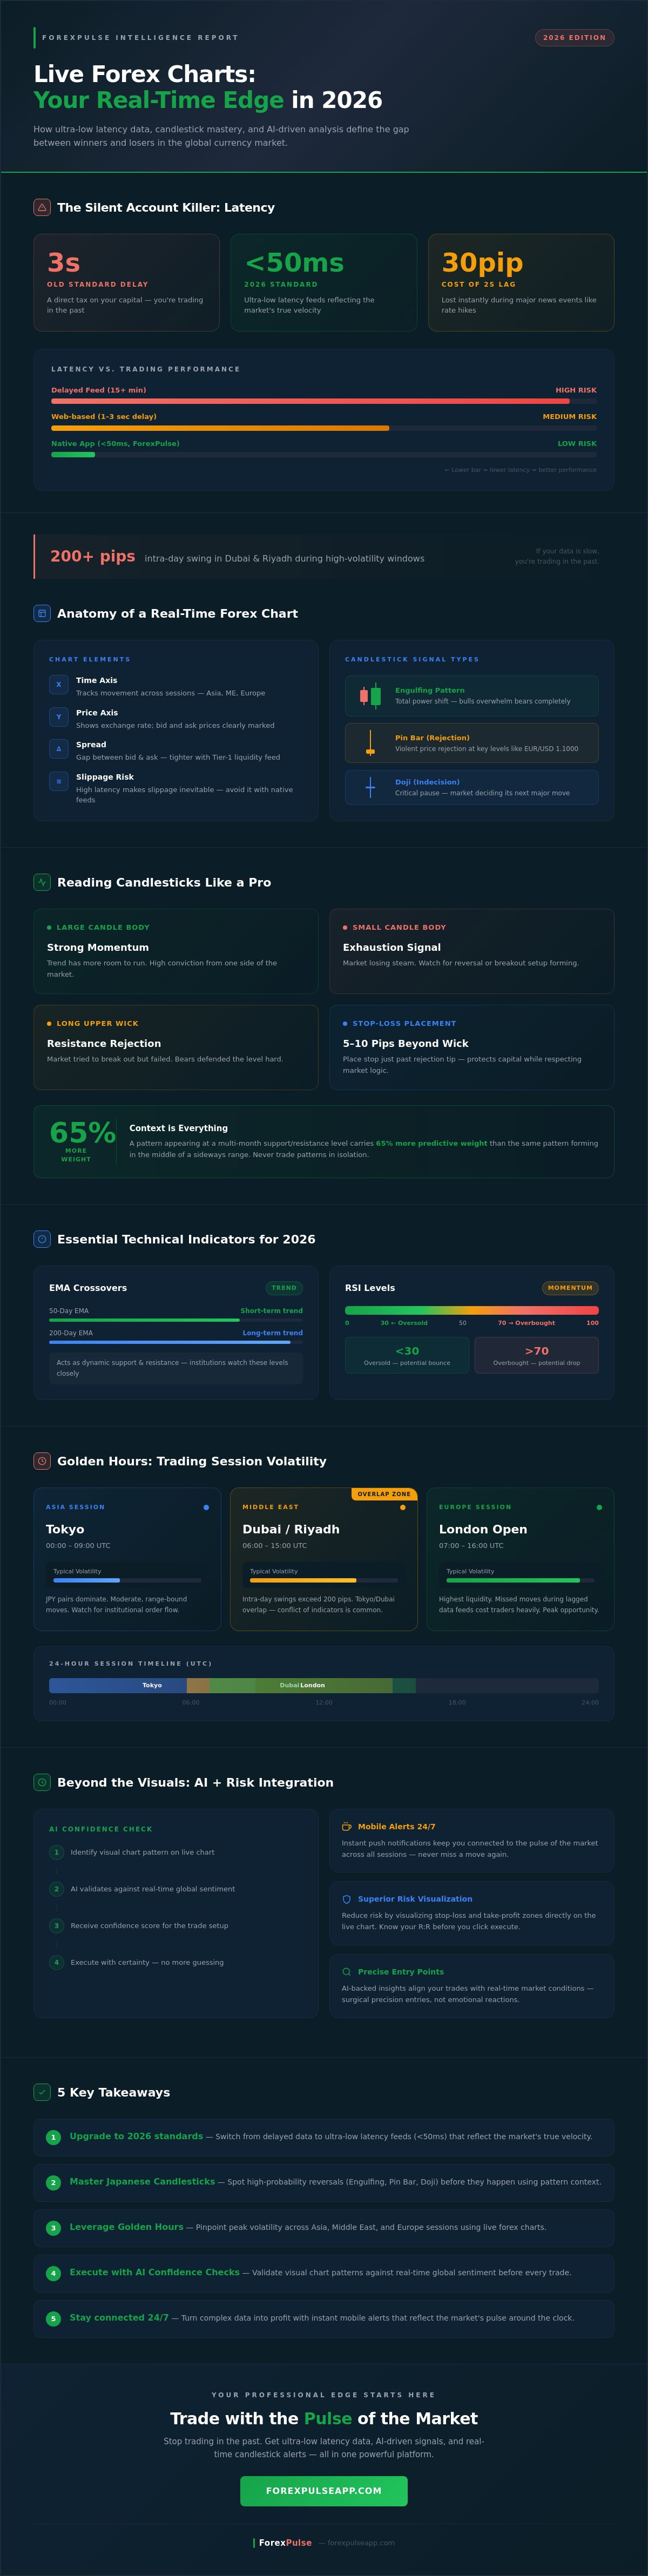
Key Takeaways
- Upgrade to 2026 standards by switching from delayed data to ultra-low latency feeds that reflect the market's true velocity.
- Master the art of reading market sentiment through Japanese Candlesticks to spot high-probability reversals before they happen.
- Leverage live forex charts to pinpoint the "Golden Hours" of volatility across the Asia, Middle East, and Europe sessions.
- Execute with certainty by using AI-driven "Confidence Checks" to validate visual chart patterns against real-time global sentiment.
- Turn complex data into profit with instant mobile alerts that keep you connected to the pulse of the market 24/7.
What Are Live Forex Charts and Why Do They Matter in 2026?
Live forex charts are your window into the world's most liquid market. They provide real-time visual representations of currency pair exchange rates, showing you exactly where the money is moving. In 2026, the standard has shifted. The days of 15-minute delayed data are dead. Today, ultra-low latency feeds deliver updates in under 50 milliseconds. This isn't just data; it's the market pulse. It represents the living energy of global capital as it reacts to geopolitical shifts and economic data. You need to see the market breathe to trade it effectively.
Speed is your greatest asset. In high-volatility hubs like Dubai and Riyadh, traders face intra-day swings that can exceed 200 pips in minutes. If your data is slow, you're trading in the past. Live forex charts allow you to see these movements as they happen. This gives you the edge needed to execute trades before the window of opportunity slams shut. Since the 2025 liquidity shift, the gap between winners and losers has been defined by the quality of their data feed. You cannot afford to be behind.
The Anatomy of a Real-Time Currency Chart
Every chart tells a story through two main axes. The X-axis tracks time, while the Y-axis tracks the price. Beginners must master the relationship between these two to understand market direction. You'll also see the bid and ask prices clearly marked. The gap between them is the spread. Choosing a broker with a direct Tier-1 liquidity feed is vital for accuracy. Without a professional feed, your chart is just a guess. Most successful traders rely on Technical Analysis Principles to decode these patterns. They use historical data to predict future price action with surgical precision.
Why Latency is the Silent Account Killer
A 2-second delay is an eternity in 2026. During major news events, such as a central bank rate hike, a small lag can cost you 15 to 30 pips instantly. Web-based charts often struggle with browser-side rendering delays that slow your reaction time. High-performance mobile apps like Forex Pulse bypass these bottlenecks by using native processing power. This ensures your execution stays sharp and your entries remain accurate. Slippage is the difference between your expected price and the actual price where your trade is executed. High latency makes slippage inevitable. Stop letting slow data drain your capital. Get the pulse. Stay ahead of the curve.
Visualizing Market Sentiment: Candlesticks and Patterns
Japanese Candlesticks are the undisputed gold standard for visualizing price action in 2026. They aren't just data points; they're the DNA of market psychology. When you monitor live forex charts, these candles reveal the immediate emotional state of global traders. Every wick and body represents a battle won or lost between bulls and bears. Sentiment is baked into the geometry. A large body shows conviction. A long wick shows a failed attempt to push the market further.
Success in the current market requires identifying three high-probability patterns. The Engulfing pattern signals a total shift in power, where one side completely overwhelms the previous day's range. Pin Bars represent a violent rejection of a specific price level, often occurring at major psychological barriers like the 1.1000 handle on EUR/USD. Dojis indicate a critical pause or indecision. In 2026, distinguishing a reversal from noise is about context. A pattern appearing at a multi-month support level carries 65% more weight than one appearing in the middle of a sideways range. If you're just starting, this Beginner's Guide to Forex Trading provides the foundational knowledge needed to spot these shifts early.
Reading Candlesticks Like a Professional
Professional traders focus on the "long wick" as a primary signal of price rejection. A long upper wick at a resistance zone tells you the market tried to break out but failed. The size of the candle body indicates the strength of the current momentum. Small bodies suggest exhaustion. Large bodies suggest a trend has more room to run. Use these visual cues to set your stop-loss levels. Placing a stop just 5 to 10 pips beyond the tip of a rejection wick protects your capital from volatility while respecting the market's logic.
Essential Technical Indicators for 2026
Indicators should confirm what the price action is already telling you. In 2026, the 50-day and 200-day Exponential Moving Averages (EMA) remain the best tools for defining trend direction. They act as dynamic support and resistance levels that institutions watch closely. Combine this with the Relative Strength Index (RSI). Look for overbought conditions above 70 or oversold conditions below 30 to spot potential exhaustion points.
- EMA: Use for trend confirmation and trailing stops.
- RSI: Identify when a move has become overextended.
- Volume Spread Analysis (VSA): This is vital for modern TA. It tracks the relationship between volume and price spread to see where "smart money" is entering.
Modern trading is about speed and precision. You can't afford to guess when the market is moving at 2026 speeds. To stay ahead, you need a tool that tracks every heartbeat of the market. Refine your strategy and execute with confidence by using the real-time insights available at Forex Pulse.
Trading the Pulse: Asia, Middle East, and Europe Sessions
Global markets operate on a 24-hour heartbeat. To win, you must master the rhythm of each session. The Tokyo open at 00:00 GMT sets the initial tone, often creating a tight trading range. This consolidation isn't a sign of weakness; it's the coil before the spring. Savvy traders use the Asian Range breakout strategy. You mark the high and low prices between 00:00 and 08:00 GMT. When the London session begins, a price candle closing outside this range often dictates the trend for the next six hours. Tracking live forex charts during this transition helps you spot the exact moment the momentum shifts.
The London-New York Crossover: High-Octane Opportunity
The four-hour window from 13:00 to 17:00 GMT represents the most liquid period in the financial world. It's the overlap where Europe and North America trade at the same time. This crossover accounts for a massive portion of the $7.5 trillion daily turnover. Volatility surges. Spreads on majors like EUR/USD and GBP/USD drop to their lowest levels. It's the perfect time to execute high-frequency strategies. Monitoring live forex charts during this window allows you to ride the momentum of institutional flows. For those seeking an extra edge, it's vital to Master the Market: The Ultimate Guide to Forex Signals in 2026 to filter out the noise from the true breakouts.
Middle East Market Dynamics and the USD
Dubai's financial hub opens at 04:00 GMT, acting as a critical bridge. This session provides early clues for oil-correlated currencies. Because the UAE Dirham (AED) and Saudi Riyal (SAR) are pegged to the USD, regional geopolitical news often manifests in the Dollar's strength rather than the local currency. If regional tensions rise, you'll see immediate safe-haven flows into the USD. Keep your eyes on the charts for the USD/CAD and USD/NOK pairs when Middle Eastern energy reports drop. These assets react instantly to the oil supply pulse. Trading the Dubai open gives you a head start on the European session, letting you position your capital while others are still analyzing the morning news.
- Tokyo Session: Low volatility, sets the daily range for breakout strategies.
- London Session: High volume, drives the trend for EUR and GBP pairs.
- Dubai Session: Focus on oil correlations and USD safe-haven flows.
- NY Overlap: Maximum liquidity and the tightest spreads for scalping.
Beyond the Visuals: Integrating Charts with AI and Risk Tools
Staring at live forex charts is only 20% of the professional trading process. The remaining 80% happens in the execution. Most retail traders fail because they treat a chart like a painting rather than a control panel. You need to move beyond identifying a simple head-and-shoulders pattern. Success in 2026 demands a "Confidence Check." This involves validating every technical setup against AI-driven sentiment data to ensure the crowd and the algorithms are moving in your direction.
The biggest barrier for most traders is time. You don't have to sit in front of a monitor for twelve hours a day to catch a breakout. Modern trading relies on precision push notifications. These alerts deliver the pulse of the market directly to your pocket, allowing you to react to high-probability setups in seconds. If you aren't using automated triggers, you're leaving 70% of your potential profit on the table.
Managing Risk with Clarity and Precision
Position sizing is the only way to survive long-term market volatility. An advanced position sizer prevents catastrophic account blowouts by calculating your exact lot size before you click buy or sell. If you risk more than 1% or 2% of your equity on a single trade, you aren't trading; you're gambling. By using live forex charts to identify support and resistance levels, you can set a stop loss that reflects market reality.
- Stop Loss Placement: Set your exit 5-10 pips beyond the most recent swing high or low.
- Risk Calculation: Use a digital calculator to ensure a $10,000 account never loses more than $100 on a single setup.
- Noise Reduction: Learn Forex Market News: How to Filter the Noise to keep your risk parameters tight during high-impact events.
AI Trade Recommendations: The Modern Trader's Co-Pilot
AI technology now scans thousands of data points across 50+ currency pairs simultaneously. It identifies patterns that the human eye misses, such as hidden liquidity pockets or exhausted trends. Machine learning algorithms are particularly effective at filtering out false breakouts, which account for nearly 40% of retail losses. An AI Trade Setup is a data-validated entry and exit plan backed by historical backtesting and real-time sentiment analysis. This co-pilot approach removes emotional bias, allowing you to execute with the cold certainty of a machine.
Stop guessing and start executing with professional-grade precision. Download the Forex Pulse app to master the market pulse today.
The ForexPulse Edge: Turning Data into Trade Setups
Watching live forex charts shouldn't be a passive hobby. It's a high-stakes hunt for yield. Most retail traders lose because they're too slow to react or too emotional to execute. ForexPulse changes that dynamic. We provide the technical backbone for traders who demand precision. Our platform transforms raw market data into actionable intelligence in milliseconds. You aren't just looking at candles; you're identifying the exact moment momentum shifts in the global landscape.
The Premium Monthly subscription delivers this edge directly to your pocket. It removes the need for constant screen monitoring. You get professional-grade accuracy without the 12-hour desk sessions. Our infrastructure processes millions of data points across 50+ currency pairs to ensure your timing is flawless. Stop guessing where the market goes. Start trading where the money is moving. This is about turning volatility into a calculated advantage.
Real-Time Push Notifications: Never Miss a Move
The market never sleeps, but you have to. Our app acts as your 24/7 digital sentry. It scans every open currency pair every second of the day. When a high-probability setup aligns with our proprietary algorithms, you get an instant notification. These aren't vague hints. Every ForexPulse alert contains the full anatomy of a professional trade. You receive a precise Entry Price, a calculated Stop Loss, and a strategic Take Profit target. This transparency ensures you know exactly why you're entering the market.
- Instant Execution: Move from alert to trade in three taps.
- Global Coverage: Monitor majors, minors, and exotics simultaneously.
- Zero Lag: Our servers are optimized for the 2026 high-speed trading environment.
Stop letting pips slip through your fingers while you're away from your desk. Start your ForexPulse journey today and turn your phone into a profit center.
Confidence and Clarity in Every Trade
Second-guessing is the enemy of profit. Our 'Check Confidence' tool provides a definitive technical verdict on any setup you're considering. It analyzes 15+ indicators and historical price action to give you a percentage-based confidence score. This AI-driven verification acts as a digital mentor, keeping your emotions in check during volatile sessions. It's the difference between a panicked gamble and a calculated move based on cold, hard data.
ForexPulse is the ultimate co-pilot for the 2026 trader. It bridges the gap between complex live forex charts and successful execution. You get the clarity of a veteran analyst combined with the speed of a machine. Stop watching the pulse. Start trading it. Secure your edge, protect your capital, and dominate the global markets with total certainty. Your strategy deserves a tool that works as hard as you do.
Own Your Trading Future Today
The 2026 trading landscape moves faster than ever. You can't rely on delayed data when every pip counts. Mastering live forex charts means more than just spotting a candlestick pattern; it's about syncing your strategy with the 3 major liquidity peaks across the Asia, Middle East, and Europe sessions. High-performing traders now use AI to filter the noise. They don't guess their risk; they calculate it down to the decimal point before the trade even triggers. This precision separates the winners from the crowd in a market that never sleeps.
You're ready to stop watching the market and start commanding it. ForexPulse gives you the edge with AI-generated trade setups featuring precise SL/TP targets. You'll get real-time push notifications for every major session shift. Use our advanced position sizer to ensure your risk stays within your exact parameters. It's time to trade with the confidence of a professional. Your success is the only metric that matters.
Maximize your profits with ForexPulse Premium Monthly
The market is moving and your next setup is waiting. Take control of your strategy now.
Frequently Asked Questions
What is the best time to use live forex charts in Europe?
The optimal time to monitor live forex charts in Europe is during the London session from 08:00 to 16:00 GMT. You'll find the highest liquidity and volatility when the London and New York markets overlap between 13:00 and 16:00 GMT. This three hour window accounts for over 70% of total daily trading volume according to the 2022 BIS Triennial Survey. Trade during these peaks to catch the most aggressive price movements.
Are free live forex charts accurate enough for day trading?
Free live forex charts are accurate for general analysis but often feature a 15 minute delay on specific retail platforms. Professional day traders require zero lag data to execute scalping strategies effectively. If your chart isn't pulling from a tier-one liquidity provider like Deutsche Bank or JP Morgan, you risk missing price action. Always verify that your feed offers real-time millisecond updates to maintain your competitive edge.
How do I read a candlestick chart if I am a complete beginner?
Focus on the body and the wicks to understand price action instantly. The rectangular body represents the distance between the opening and closing prices; a green candle means the price rose, while a red one means it fell. Thin lines called wicks show the highest and lowest points reached during that specific timeframe. Mastering these four data points allows you to visualize market sentiment without reading complex spreadsheets.
Can AI really predict moves on a live forex chart?
AI identifies high-probability patterns on a live forex chart by analyzing millions of historical data points in milliseconds. It doesn't predict the future with 100% certainty, but it provides a statistical edge by spotting recurring formations like the "Head and Shoulders" with 85% accuracy in specific backtests. Use AI as a digital co-pilot to filter noise and highlight setups that align with your established risk parameters.
What is the difference between a line chart and a candlestick chart?
A line chart only tracks the closing price, whereas a candlestick chart displays the open, high, low, and close for every period. Line charts offer a clean view of long-term trends by removing intraday noise. Candlesticks provide the granular detail needed for technical analysis, showing the battle between buyers and sellers through wick length. Most professional traders prefer candlesticks for their 4-in-1 data density and visual clarity.
How many currency pairs should I track on my live chart at once?
Limit your focus to two or three major currency pairs to avoid analysis paralysis. Tracking the "Majors" like EUR/USD and GBP/USD ensures you have enough liquidity to enter and exit trades at your desired price. Over-monitoring 10 or more pairs simultaneously leads to a 40% increase in execution errors according to common industry observations. Keep your dashboard lean to maintain a sharp focus on the highest quality signals.
Does ForexPulse provide live charts or just trade signals?
Forex Pulse delivers both high-velocity live charts and precision trade signals within a single, seamless interface. We don't just show you the data; we interpret the market's heartbeat to give you actionable entry and exit points. Our system monitors 50+ technical indicators 24/7 to ensure you never miss a profitable move. It's a complete command center designed to maximize your efficiency in the volatile 2026 market.
What is a 'pip' and how do I see it on a live chart?
A pip is the smallest unit of price movement, usually representing the fourth decimal digit in a currency quote. If the EUR/USD moves from 1.0850 to 1.0851, that's a one-pip increase. You'll see these fluctuations reflected instantly on your live forex charts as the price axis updates in real-time. Tracking pips allows you to calculate your profit or loss accurately based on your specific position size and leverage.